Friday, 15 June 2018

Growth Commission: A Simple Mistake

I'm indebted to Fraser Whyte who first spotted this rather significant error in the Growth Commission report and blogged about it here.

I trust Fraser - he's good - but what he identified was such a howler that I wanted to check and, having a bit more time, dig a layer deeper.  Fraser was right - if anything it's even worse than he thought.

So here we go, with references to the Growth Commission report indicated [thus]...

The largest claimed saving is for spending reductions compared to allocated UK government spending of 0.8% of GDP [B4.67]. The justification for this figure in the report is unclear and based on demonstrably flawed assumptions.

The report suggests [B4.57] a comprehensive 2 year review to analyse “where savings could be made where costs need not be replicated”.

The report then [B4.58] seems to declare the result of this proposed analysis by stating “This analysis shows an improvement in the public finances of around £1 billion [...] the equivalent of 0.8% of GDP”

An immediate concern here is that £1 billion is in fact 0.67% of 2016-17 onshore GDP1, but the figure of 0.8% is the one the report goes on to use.

A bigger issue is the way in which the £1 billion figure is justified. It is explained [B4.58] as being made up of savings of £0.4bn and revenue benefits of £0.6bn.

The asserted potential saving of £0.4bn from costs “that will no longer be required” is supported by a few examples that total just £170m2. Even the examples given are not well justified3 and include a sweeping “more than £100m for Whitehall running costs that will not need to be duplicated in Scotland”.

The revenue benefit of £0.6bn is explained as being associated with £2.4bn of “spending that is allocated to Scotland but takes place elsewhere”. Not only does this £2.4bn include costs that the report has just assumed will be saved (and so can’t be transferred), the assertion that all of this £2.4bn4 of spending currently allocated to Scotland takes place outside of Scotland is simply and very materially wrong.

To illustrate: the £2.4bn includes £484m [Table 4-2] of ‘Public & Common Services’ costs. In 2015-16 the equivalent figure was £467m, a figure we can break down in detail by using the GERS expenditure database.

This shows us that not only does this figure include all of the costs that the Growth Commission has explicitly assumed will be saved5, but that it includes spend which already takes place in Scotland.

The figure includes, for example, £234m6 of current expenditure on HM Revenue & Customs, this being Scotland’s 8.3% population share of the total UK figure7. In fact we know that 12% of HMRC headcount is currently based in Scotland8, so it is simply wrong to assume that Scotland would benefit from transferring this expenditure to Scotland.

In fact, in this specific example it seems likely that Scotland would see economic harm as a result of independence, as a greater share of HMRC employees are in Scotland than Scotland’s population share9.

This reveals another flaw in the analysis: not only are the Commission fundamentally wrong in assuming that no central spending allocated to Scotland takes place in Scotland, they don't consider the mirroring effect which is that there will be costs spent in Scotland that are currently allocated to the rest of the UK.  What the true net effect of this is would require deeper analysis - but we can be sure that the Growth Commission's analysis is simply and very significantly wrong.

So the assumed saving of 0.8% of GDP from spending reductions (compared to GERS allocated UK government spending) falls apart when tested and is clearly heavily overstated.

Two years they spent writing this report.

Two years.


Notes:

1. Using 2016-17 GERS figure of £150,025m for onshore GDP (£1bn is 0.63% of the £159,389m total GDP figure)

2. [B4.58] £50m associated with running costs of the House of Commons & House of Lords, £20m for the Scotland Office and “more than £100m for Whitehall Department running costs”

3. According to the 2015-16 GERS expenditure database, a total of just £36m is allocated for House of Commons and House of Lords; the Scotland Office figure is £23m

4. This figure appears to be made up of total allocated spending [Table 4-2] of £4.7bn less international affairs (£0.8), all economic affairs (£1.0bn), and we presume accounting adjustments and EU transactions (£0.5m)

5. House of Lords & House of Commons (£36m), Scotland Office (£23m) and various “Whitehall Costs” including Cabinet Office, DfID, HMRC, HMT etc.

6. This £234m is categorised as “non-identifiable expenditure” in the database, but this does not mean the expenditure takes place outside Scotland. We suspect this may have been the cause of the Commission’s misunderstanding

7. £2,838m, defined in the GERS expenditure database as: HMR041-S041A003-UK-TES_CUR-Non-ID-CG-SUB010100

8. Institute for Government, “Governing after the Referendum” - Figure 2, page 24

9. Of course to answer this question properly we’d need to know the share of spend, not just share of employment – but the point at issue here is that the Growth Commission’s assumptions are clearly and materially flawed.

Tuesday, 5 June 2018

Growth Commission: Cohort Selection

As a quick exercise I wanted to check how the Growth Commission's "peer group of 12 countries" had been selected. The report offer no explanation at all other than by inference - so I used the same data sources they used to create an objective list of comparable small countries.

My criteria are very simple: countries which qualify as IMF "advanced economies", ranked by size. I've added IMF 2016 GDP/Capita ($US) for comparison purposes as this is the primary measure the Growth Commission use. The highlighted countries are those selected for the Growth Commission's “peer group of the 12 most successful small advanced economies”.


The important point to make here is that this cohort has been pre-screened for success. All of those countries excluded that lie within the population extremes of those selected have lower GDP/Capita than Scotland (and indeed at both the higher and lower end, the population extremes conveniently stop just the right side of examples where GDP/Capita is lower than Scotland's).

There is nothing wrong with this as long as we appreciate that the Growth Commission is seeking to learn from successful small advanced economies. What they are unable to do from the analysis presented is draw any robust conclusions about whether or not small advanced economies are somehow intrinsically more successful than large ones.

It's perhaps unfortunate that in the introduction to the report (p10, 2.28) the Chair Andrew Wilson asserts “The evidence demonstrates that smaller countries, partly because of their greater need to respond to global challenges, produce better governance, policy and therefore living standards.” 

This may or may not be the case, but no such evidence is presented in the report.

Saturday, 2 June 2018

Andrew Wilson's Doublethink Masterclass

I'll keep this brief.

I've just caught up with Andrew Wilson's Sunday Politics Scotland interview from 27/05/2018. If you want to hear the words I'm taking issue with being spoken, watch here from 7:30


Verbatim, emphases mine:
"well in fact, we do the opposite of what the OBR and George Osborne has done because we don't put assumptions for growth into the numbers - we could have just said 'well we've modeled it, we think growth's going to be faster and look here, everything's fine' ... [interviewer interruption] .. well, we assume that over time the average performance of the past is the average performance of the future for inflation and growth, and we say 'what would you do?' - now the point of this Gordon if I may say is, that without making wild predictions for growth we show how over a period of 5 to 10 years - while growing the public finances, rejecting austerity, stewarding growth at the same time - we can bring discipline to the public finances sustainably."
You might want to watch the clip to believe that's what he said, but it is - and it's consistent with his comment to me on Twitter that "there is no growth rate assumption".

So let's quickly unpick the bizarre logic of the first half of this extract before turning to the assertion in the second half.

He states "we don't put assumptions for growth into the numbers" before then describing the assumptions for growth they put into the numbers: "we assume that over time the average performance of the past is the average performance of the future for inflation and growth".

So they do put assumptions for growth into the numbers - which is obvious because without assumptions for growth they couldn't make the assertion he then goes on to make.

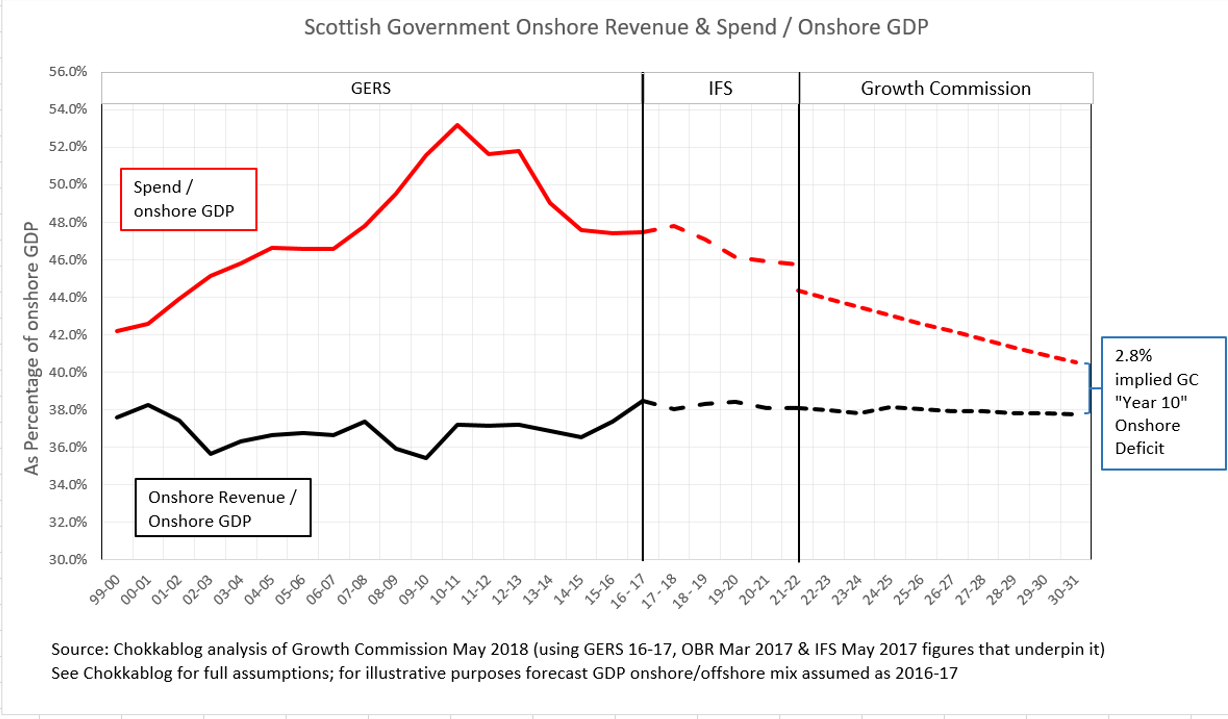
We know this anyway because the report is explicit about the assumption used to drive the analysis that AW refers to when he says "we show how over a period of 5 to 10 years [..] we can bring discipline to the public finances sustainably". He's referring to the analysis behind this graph (note how 9 years has become "5 to 10 years");


It's genuinely baffling to me that AW would say "we don't put assumptions for growth into the numbers" when the assumptions that are required to support the assertion he goes on to make are explicitly laid out in the report itself


[These aren't always easy to read: B12.18 makes explicit a 1.5% pa real GDP growth assumption]

I've been through detailed analysis of this in other blogs (eg. here) but in essence the sums are really simple (and by the way don't require any inflation assumptions at all, presumably they're in there just to allow better sounding nominal figures to be quoted).

You only need a three row spreadsheet to show that if you grow Spend 1% slower than GDP then - all other things being equal - a 5.9% deficit would indeed become less than a 3% deficit after 9 years (because spend/GDP necessarily declines). If you like, here's that in graph form and in the context of historical actuals and the various deficit figures you will see quoted in the report (more detail here)


By rights we should show this graph based on onshore GDP only, although it doesn't materially change the conclusion


OK, so we know that in fact AW has made an assumption for growth to make his statement stack up. 1.5% assumed real GDP growth means that, if spending growth is 1% less, then that's 0.5% real spending growth - which allows AW the soundbite of "growing the public finances, rejecting austerity" because real spending is increasing.

In that clearly well-rehearsed sound-bite he also says "stewarding growth at the same time" - I think maybe he should have said assuming higher growth at the same time.

So he's made a growth assumption and it's a really important one - if that assumption was less than 1.0% then he'd be advocating real spending cuts to "bring discipline to the public finances sustainably".

So let's look at some actual real GDP growth rates

  • Over the "austerity decade" from 2006-07 up to 2016-17, Scottish onshore GDP showed average real growth of just 0.8% pa
  • The latest forecast from the Scottish Fiscal Commission (published 31/05/2018) is for GDP growth in 2023 to be running at 0.9% pa

Hold on. If real GDP growth is less than 1.0% then applying AW's fiscal rule of getting the deficit down to below 3% within 10 years would require public spending cuts - would require austerity far and above anything we've seen while being in the UK, as this simple graph illustrates;


Now to be fair, it's true that if you go back long enough (I reckon 14 years) then you can get to an historic average real onshore GDP growth rate of 1.5% - but that takes you back to when the economy was booming. Making assertions about how you would "reject austerity" if the economic conditions were such that even George Osborne would not be suggesting austerity is hardly a meaningful contribution to the debate.

What matters is what you do when times are harder than average, when real GDP growth is less than 1.0%. Andrew Wilson works hard to be distinctly unclear about this (as did Commission member MSP Kate Forbes on Question Time) , but the Growth Commission report is clear for those who can be bothered to read it: if GDP growth was as sluggish as it has been for the last decade or as slow as the Fiscal Commission forecast, the Commission recommends embracing austerity as enthusiastically as any Tory chancellor.


* Addendum *

This is astonishing - I've just seen what Nicola Sturgeon said at FMQ's on Thursday (from 12:41)


Verbatim, emphases mine:
"I've got some analysis here which I'm going to share with the chamber, and hopefully it'll be ... it'll be of embarrassment to the Tories, hopefully it'll be of interest to Labour. If the spending recommendations of the Growth Commission had been applied over the past ten years, the £2.6bn real-terms cuts imposed on the budget of the Scottish government by Tory governments at Westminster would have been completely wiped out, it would have eradicated austerity in Scotland. That is the reality"

Anybody who has read this post or indeed my post on similar claims made by SNP MSP Kate Forbes on Question Time  will know that that very much is not "the reality" - that is in fact a big steaming pile of horseshit.

* Addendum 2 *

And today I'm told that Andrew Wilson is quoted as saying this in the National [he did - here]


Anybody who has read the report and/or who has followed my recent blogs and/or who has thought about what applying the report's deficit reduction "model" would mean will know that this isn't spin, it isn't doublethink - it's an out and out lie.

Friday, 1 June 2018

Kate Forbes SNP MSP Question Time Claim

Kate Forbes MSP sat on the SNP's Sustainable Growth Commission (see blogs passim).

I was just catching up with Thursday Night's Question Time and was taken aback when she made the following statement (about 31 mins in);
"Over the last 10 years the Scottish Budget has been cut by 8.5%; in contrast, this report predicts that if we had been an independent country our spending could have increased by 5% over those 10 years. Minus 8 to plus 5."
Now.

I've spent a fair amount of time with the numbers in the Growth Commission report and I didn't recognise the figures she quoted at all. I went back and had another look, I searched (based on the quoted figures and likely phrases) but with no joy. I asked around - an opposition MSP friend said he'd heard SNP members making similar assertions in the Chamber during FMQs. I was curious.

So I tweeted Kate (and the report's author Andrew Wilson) asking for a page reference ... and then ploughed ahead anyway trying to work how she could possibly justify that statement.

To her great credit, Kate DM'd me just as I'd finished this piece (late on a Friday night) and offered me her brief explanation which I'll *reveal* as we go - so do stay awake.

In her quote she rhetorically compares actual figures for the "Scottish Budget" to what sounded like some weird predicted-historical figure for "our spending".

I don't want to disappear down a rabbit-hole of different Scottish Budget line definitions (have a burrow here if you're really interested) - but instead I'll focus just on total Scottish Spending, as that's what matters and it's what the Growth Commission focus on. [first reveal: I now know that this was indeed the figure Kate was referring to for her "plus 5"].

The Growth Commission rightly uses GERS as its main source and so should we.

The Growth Commission states:
"real increases in public spending should be limited to sufficiently less than GDP growth over the business cycle to reduce the deficit to below 3% within 5 to 10 years" [3.187]
Given how big our notional deficit was in these last 10 years (peaking at 10.0%) I think we can safely assume that the report would "predict" - if it did, which it didn't, but if it did it would - spending growth slower than GDP growth.

So let's look at the Scottish figures for the last 10 years (2016/17 vs 2006/07)
  • Real GDP Growth (inc N Sea): -1.9%
  • Real GDP Growth (onshore only): +8.0% (or +0.8% pa)
Clearly the Growth Commission is focusing on the onshore economy, so applying their rule would suggest that we "could have" increased our total spending by something "sufficiently less than" 0.8% pa.

The Growth Commission suggest spending growth at 1.0% pa less than GDP growth [see their Fig 12-2 and point B12.18] and illustrate (correctly) that this would reduce a 5.9% deficit to a 2.9% deficit over 9 years.

Note that in 2009/10 our deficit was in fact 10.0%, so at that point one would argue we'd have needed a far more aggressive rule, but we'll let that pass.

If we applied the "1% less than GDP growth" rule over the last 10 years, then we would have needed to see an average annual real decline in spending of 0.2% pa - or a decline over 10 years of 2%.

What we actually saw - per GERS - was a real spending increase over those 10 years of  10.1% (an average increase of +1.0% pa).

So in Kate's terms: applying the Growth Commission's "prediction" to the last 10 years would see what was actually a 10.1% increase in spending become a 2.3% decrease. Plus 10 to minus 2.

Kate claimed "minus 8 to plus 5" - following the logic above, a fairer statement would have been  "plus 10 to minus 2" - almost the complete reverse.

So what's going on here?

Two things;

1. Kate is not comparing like with like. The Scottish budget is a subset of total Scottish spending - the Growth Commission rightly focuses on total Scottish spending, so should Kate when she talks of what could have happenend and so should we. [I also suspect her -8.5% figure includes budget forecast out to 2019/20 rather than purely historic data, but I honestly can't be bothered to check]. Basically the "minus 8" is boohickey.

2. [second reveal] Kate has been good enough to tell me that she arrived at her +5.0% "based on what the GC recommends in terms of increased public spending in Scotland over a 10 year period (by 0.5% per year)"

I'm incredulous.

She's compared a non-comparable subset of our historical public spending over a period during which average onshore GDP growth was actually 0.8% pa with a projection that assumes real GDP growth of 1.5% pa!

The very simple point which Kate (a Commission member, remember) has apparently misunderstood is that the figure of  0.5% pa is most definitely not the GC's spending growth recommendation - it's an illustration of how you could get the deficit down to 3% within 10 years if real GDP growth was 1.5% pa

But over the last 10 years real GDP Growth wasn't 1.5% pa, it was 0.8% pa - so to have got the deficit down at the rate the Growth Commission recommends, we'd have had to reduce public spending in real terms by 2% over those 10 years.

In fact - due to pooling and sharing within the UK, due to not having to focus on getting Scotland's deficit rapidly down to 3% - we were able to increase our public spending by 10% over that period.

The precise opposite of what Kate claimed is true.


Read the quote again:
"this report predicts that if we had been an independent country our spending could have increased by 5% over those 10 years"
She asserts that the report says something about what could have happened over the last 10 years. It simply does not.

She implies that the report's recommendations - if applied to the economic conditions we experienced during the last 10 years - would have led to 5% spending growth. They would not have.

Hell, even if you very generously interpret her statement as suggesting that the report predicts 5% spending growth over the next 10 years, that isn't true either.

The Report's Chairman has pointed out to me that the report makes no growth forecasts (see here) - so it can't be making any predictions about spend levels other than spend relative to GDP.

I think we're meant to understand that when the report [B12.18 and Fig 12-2] assumes 1.5% real GDP growth and 0.5% real spending growth, this is merely illustrative of how one could get a deficit down from 5.9% to below 3% within 10 years. I certainly hope so, because just yesterday the Scottish Fiscal Commission forecast that our GDP growth would be 0.9% in 2023 - on that basis the report "predicts" that spending growth would need to be 0.9% - 1.0% = a decline of 0.1% pa.

Still, the statement sounded good on Question Time and way more people watch that programme than will ever read this blog - so Kate can be happy, safe in the knowledge that she's done her bit to ensure the "new debate about independence" will be as fact-free as the last.

** Addendum **
I now see that Kate was merely following the lead set for her by the Report's Chairman Andrew Wilson and indeed our own First Minister Nicola Sturgeon - I've blogged the details here
***


***
For those who are disappointed there wasn't a graph in here, this is what Scotland's spending would have looked like if we had applied the GC's rule of spending growth being 1% behind GDP growth last time our deficit rose to the levels the GC uses as its starting point


It's pretty clear that if applied historically, the Growth Commission's spending growth recommendation would have led to greater spending cuts than those we've experienced under the "Westminster austerity model" the Commission claims to "explicitly reject".