Wednesday, 21 December 2016

Impact of UK Austerity on Scotland's 2017-18 Budget

When Finance Secretary Derek Mackay announced his party’s Budget last week, he came under pressure for many reasons, not least because buried in the detail was the fact that the SNP are imposing a £327m cut in central Government support to local government services1.

Mr Mackay defended his budget by saying "Let me be clear, I will not pass the costs of UK austerity on to the household budgets of the lowest-income taxpayers"2 and in the budget document itself stated “The UK Government’s approach to public spending is having a significant detrimental effect in Scotland”3.

The problem here is that - as so often with the SNP - the rhetoric is plainly at odds with the facts. I’ve taken the time to study the actual figures in some detail, and it’s clear that attempting to blame UK Government austerity for cuts in Scotland’s 2017-18 budget is nothing short of blatant deception.

All you need to understand to realise that Mr Mackay is trying to pull the wool over our eyes is this simple graph showing the Total Scottish Budget in real (inflation adjusted) terms over the last 10 years. [Note y-axis does not start at zero]


I expect a lot of people in Scotland will find this graph hard to believe. After all, we hear so much from the SNP about Tory austerity that few would expect the real-terms trend in Scotland’s budget to be upwards over the last four years – but that is the reality. In fact, if you look carefully at the graph, you’ll see that Scotland’s Budget is now (just) higher in real terms than it was in 2009-10 before austerity cuts started to bite.

How come this plain reality isn’t common knowledge? Well the simple fact is that the SNP have gone out of their way to hide this information. If you take the time to look up last week’s budget report, you’ll find the summary tables they include show data for 2010-11 but then just miss out the four intervening years to 2014-155. That’s the first step they take to disguise the reality of the rising budget trend.

The second step they take is to bury this Total Budget information deep in an Appendix on page 169 of the report. They use the up-front summary tables to instead focus on a few sub-totals that exclude things like Annually Managed Expenditure (AME) which, for example, pays for NHS and teachers’ pensions4.

In some highlighted figures they even exclude Capital Borrowing4. This is a devolved power that enables Scotland to spend more by taking on further debt in addition to that we share with the rest of the UK. It’s a critical and growing source of funding for Scotland and it’s hugely misleading to focus on figures that omit it.

The third step they take is to distract from the budget year that’s actually being announced by providing a pretty meaningless longer term forecast. The longer term forecast they made last year has already been shown to be far too pessimistic6. To illustrate how flaky their latest forecast is, despite the clear commitment from the SNP to deliver a 50 per cent reduction in the “overall tax burden of APD” (Air Passenger Duty), their forecast makes no allowance for this £171m headline revenue loss4.


As an aside, it’s also the case that by the end of their forecast period the Scottish Government will control roughly half of the revenue raising powers involved. So when they forecast a real terms decline in “Fiscal DEL” (a subset of the total budget that excludes among other things, AME and capital borrowing), the Scottish Government appears to be forecasting that their own economic strategy will fail.


So by missing out intervening years, focusing on a measure which excludes very significant sources of revenue and stretching to an unrealistically pessimistic forecast year, the SNP are able to engineer a figure which appears to suggest “Westminster austerity” is causing the budget to decline. In fact, as the graph clearly shows, the opposite is true.

The reality of our fiscal framework agreement with the rest of the UK is such that the SNP is lucky enough to preside over a spending budget that’s rising in real terms.

The fact that the SNP are cutting Central Government funding to local government is their choice, not something that’s forced upon them - just as the fact that the SNP don’t use their income tax and benefits top-up powers to reduce tax for low-earners, redistribute wealth and address inequality is their choice.

Next time you hear UK austerity being blamed for specific Scottish budget cuts, remember this simple fact: over the four years from 2013-14 to 2017-18, the Total Scottish Budget has been increased in real terms by £1.9bn or 5.4% . 

It really is long past time the SNP stopped blaming Westminster for their own failings.


******

Notes
1. Table 9.02: Local Government and Central Government Grants to Local Authorities

3. page 2 of Budget Report
4. I provide a full audit-trailed explanation of the various figures on an historical like-for-like basis here: this table shows the sources I needed to access to create it (it was hard work)

5. See Tables 1.01 and 1.02 pages 3 and 4

6. See Spinning the Scottish Budget: Part II


Tuesday, 20 December 2016

Spinning the Scottish Budget: Part III

- Seriously Kev, you're still banging on about this?

- Yes, yes I am.

You see I've invested quite a lot of effort into understanding what’s actually been going on with our Scottish Budget, and in the process it's become clear to me that the Scottish Government have gone out of their way to obscure the reality. So I think it's worth me going out of my way to make that reality clear.


To save me repeating myself: all growth percentages quoted here are real (i.e. inflation adjusted1) and all values are quoted in real 2016-17 terms.


Let’s get one possible source of confusion out of the way first: we’re going to focus here on the devolved Scottish Budget, not Total Managed Expenditure (TME) that’s shown in the Government Expenditure & Revenue Scotland (GERS) Report.

GERS TME is considered to be controversial by some because it includes per-capita allocations of defence, debt interest and foreign affairs as well as allocated costs for other reserved matters like the state pension. The following graph puts the Total Scottish Budget (blue line) in context against the GERS TME spend (black line);


I confess this is not the most exciting graph you'll ever see, but I think it's important to be clear how different the Budget (for which we now know both this year and next) is from the total GERS attributed spend on Scotland (for which we only know up to last year actual)

That black TME line is basically flat. From its peak in 2010-11 its down by 2.3% but since 2008-09 it's grown by 2.3% and last year it grew by 0.6%. But this includes stuff like debt interest and allocated defence costs and other things the Scottish Government doesn't control, so we need to focus instead on the blue Total Scottish Budget line - this is what the budget exercise is all about.

Let's zoom in by changing the y-axis scale (note it now doesn't start at zero) and adding some of the other spending definitions we'll need to understand to follow the various claims being made.


I'm astounded by how hard it has been to pull this together. I'd normally footnote this sort of thing, but to give an idea of the work I've had to do to get comparable cash figures, here's a table showing where I had to go to get like-for-like nominal (cash terms) numbers just for the most recent five years (no highlight means figures were explicit but not shown, yellow is unexplained differences2 and other background colours signify I had to source from different budget reports);


It's almost as if somebody didn't want anybody to be able to follow what's been going on since 2013-14. Anyway, all I had to do then was source the HM Treaury GDP deflator which the Scottish Government uses1 and convert the figures into comparable real terms values.


So let's now look at each of the lines on that graph.


Total Budget - the blue line
The Total Budget was cut over the three years from 2010-11 to 2013-14, but has grown since. That’s right: Scotland’s Total Budget has grown over the last 3 years and is in fact planned to grow by a further 1.1% in the coming year.

Between 2013-14 and 2017-18 the budget will have grown by 5.4% (remember: all these figures are real, inflation adjusted). For context, that's a £1.9bn increase in Scotland's spending budget over a period when North Sea oil revenues  have declined by £4.0bn.

The Total Budget for 2017-18 is in fact slightly higher than its previous peak in 2009-10 – so we’re back to pre-austerity spending levels.

You won’t find this mentioned anywhere by the SNP and you’d have to have made it to Appendix G table 4 on page 169 of the 2017-18 budget report before you'd see this data (which you'd have to adjust for inflation, as I have done).

Total Departmental Expenditure Limits (DEL) - the red line
Total DEL differs from the Total Budget because it doesn’t include Annually Managed Expenditure (AME). You’d need to make it to page 165 of the 2017-18 budget report to find just two years worth of AME data where you'd discover that for example in in 2016-17 it was £6.7bn,. The Glossary explains that AME is;
"spending that does not fall within Departmental Expenditure Limits (DEL). AME is generally less predictable than expenditure in DEL and is not subject to multi-year limits. It is set each year and contains those elements of expenditure that are not readily predictable. For example, NHS and Teachers’ pensions count as AME"
Now here I confess the limits of my tenacity and stamina were reached. Each year's budget only include two years of AME data and the information for DEL in these budgets only goes back as far as 2010-11. So I merely observe that (by implication) AME has grown faster than DEL over the graph period (i.e. the blue and red lines diverge slightly)

If you think only DEL matters and we should ignore AME, good luck explaining your logic to a Scottish teacher or a nurse whose pension is paid by it.

But even if we do look just at DEL, it’s still grown by 3.1% since 2014-15.

Discretionary Spending Limit - the grey then gold line
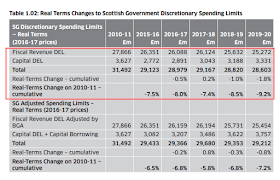
I've called this "Discretionary Spending Limit" as it's the last total in table 1.02 which has this title -  but that row is rather cumbersomely named "SG Adjusted Spending Limits" in the table itself.

To get from DEL to this “Discretionary Spending Limit” we need to subtract both “non-cash DEL” and “financial transactions”. Stick with me, we’re nearly there.

"Non-cash DEL” is basically depreciation, a figure that needs to be accounted for but is a “given” as far as planning the budget is concerned. It is (annoying inconsistently) described in the Budget Glossary as "Ringfenced Resource DEL (non-cash)":
"depreciation or impairment costs associated with the ownership of assets. HM Treasury rules mean that this element of the overall DEL budget cannot be used to fund pay or procurement costs and as such this budget does not represent spending power for the Scottish Government."
I'm not sure if that second sentence makes grammatical let alone logical sense - depreciation costs aren't cash, so it's hardly because of "HM Treasury Rules" that they can't be used to "fund pay or procurement costs" (answers on a postcard).

I'm tired and confess I’ve not really got my head around “financial transactions”. It seems clear to me that this is real money, albeit effectively in the form of borrowing for restricted use. The definition offered is
"Financial Transactions are allocated by HM Treasury to the Scottish Government and can only be used for the provision of loans or equity investment beyond the public sector. Financial Transactions facilities have to be repaid to HMT in future years."
We'll talk more about borrowing in a moment - but just because it's borrowing doesn't mean it doesn't count when it comes to money available to spend in the Scottish budget.

So we're now looking at a sub-set of the Total Budget that excludes loads of highly relevant figures - and this is basically flat over the last five years (actually +0.2%).

"Fiscal Revenue + Capital DEL" - the grey line
Prior to 2015-16 this was the same as the Discretionary Spending Limit, but as it doesn’t include Scotland’s devolved capital borrowing it's a pretty meaningless figure from 2015-16 onward.

I can't emphasise this point enough - to consider our spending capacity without considering the money we can borrow directly (as opposed to Westminster borrowing it on our behalf) is simply ridiculous.

The 2016-17 budget presented this figure as an emboldened total called "SG Spending Limits" and showed its growth relative to 2010-11 (when of course there was no devolved capital borrowing power). This is repeated in the 2017-18 budget when it is shown again as an emboldened total with growth figures in the "Discretionary Spending Limits" Table, just named "Total":
This is hugely misleading, it's a ridiculous figure to draw people's attention to. At least in this year (unlike last year) an "SG Adjusted Spending Limit" total is included below which at least does include Capital Borrowing but - as you will now understand - still excludes a lot of spending that is essential to the Scottish budget.


. ****
As explained in my previous blog the forecasts beyond the budget year in question are frankly a distraction and of marginal value at best.

So there you have it. Faced with a budget that's rising in real-terms and is now back to it's pre-austerity peak level, the SNP managed to come up with this summary:
"The UK Government’s approach to public spending is having a significant detrimental effect in Scotland. Between 2010-11 and 2019-20, the Scottish Government’s Fiscal Departmental Expenditure Limit (DEL) from HM Treasury will fall by over nine per cent in real terms – the equivalent of over £2.8 billion"
So that's taking a figure from the peak forward to a pretty meaningless forecast and - outrageously - that 9.2% means they're using the "Fiscal Revenue and Capital DEL" (aka Fiscal DEL) that excludes the impact of Capital Borrowing.

I'm sorry - that's just wrong.


*****

Notes
1. Using the HM Treasury GDP deflator as referenced by the 2017-18 Budget
2. The figures in this table show that (sourced from within the same budget report) the Total Budget does not equal DEL + AME  as we would expect.  But then taking the 2017-18 budget as an example, the Total DEL figures on page 168 do not tie to the figures in the up-front summary either (a £217m difference for 2016-17 year) so frankly I start to give up.

Sunday, 18 December 2016

Spinning the Scottish Budget: Part II

Yesterday I rushed out a blog looking at the figures that were (and just as importantly were not) shown in the Scottish budget (> Spinning the Scottish Budget).  I've had some time now to dig a little deeper and if anything the spin is worse than I initially thought.

Let's be very clear: the budget is for 2017-18 so that is the year that matters, the year for which decisions are being made.

So let's look at the figures shown for real year-on-year growth in "Fiscal DEL" (aka Discretionary Spending Limits) for each of the last four draft budgets;


Not showing the real year-on-year growth for 2017-18 in the 2017-18 budget is a glaring omission is it not? The data to calculate the figure is of course there, it's just disguised in cumulative percentages and absolute totals. So let's fill in the gap (and while we're at it we'll show what the actual prior-year real terms year-on-year growth figures turned out to be):


So the first observation we can make (as per my last blog) is that Fiscal DEL is budgeted to increase by 0.7% in real terms for 2017-18.  If you've been listening to the SNP's rhetoric you would be forgiven for thinking that this budget was severely hampered by spending cuts due to "Westminster Austerity" - it may be impacted by that, but the net effect still allows real spending growth.


Note also that Fiscal DEL doesn't include new capital borrowing powers - factor those in (and other adjustments) and Total DEL actually rises by 1.1% next year (the only year we're actually budgeting for here) - see last blog for more detail.


The other thing that jumps out (and has caused me some headaches) is that it appears the actual real-terms Fiscal DEL trend in prior years was nowhere near as bad as presented in the draft budgets. I've spent quite a while trying to work out why, and it seems it's all down to the difference between inflation assumptions used at the time and the actual HM Treasury GDP deflator now known. What matters is the bottom row in the table above - that is the actual real terms year-on-year changes in Fiscal DEL based on the actual nominal figures in prior draft budgets (the known actuals, not the forecasts) adjusted by the most recent HM Treasury GDP deflator (as used for the current 2017-18 budget).

This was been a real pain to pull together because neither the 2016-17 or the 2017-18 forecasts show the actuals for 2014-15 or before (despite showing the actuals for 2010-11). If I was a cynical soul I'd think this was a conscious decision to hide the fact that the real-terms decline in 2014-15 was nowhere near as bad as forecast at the time and that 2015-16 actually saw a real-terms spending rise despite the fall forecast.


The fact that 201-11 data is shown in all cases does give me reasonable confidence that the nominal figures I have deflated here are comparable on a like-for-like basis, but I can't be 100% sure. If anyone has an alternative analysis that contradicts my analysis (using the latest HM Treasury GDP deflator) then I'd love to see it and would be happy to compare notes


But what about the longer term forecasts that are included in the Draft Budget - don't they show we face further budget cuts down the line?  Well, let's just say that the forecast presented is at best extremely crude.

To illustrate, the graph below shows the real-terms discretionary DEL forecasts produced in each of the last four years (indexed to 2013-14):


Note that to be able to see what's happening the y-axis doesn't start at zero - the index makes it easy to scale the movements in percentage terms.

It's clear that the real-terms forecasts used have always turned out to be pessimistic - so despite the rhetoric of "Tory Cuts", in fact what we've seen is more like a real-terms spending freeze. Still painful of course, but not as bad as you'd think if you happen not to be obsessive enough to attempt this analysis yourself.

When it comes to how far forward to forecast, the Budgets are also hugely inconsistent (the longer term forecast has only recently been added as a distraction - sorry "innovation")
  • The 2014-15 budget forecast the budget year + 1 additional year
  • The 2015-16 budget forecast the budget year only
  • The 2016-17 budget forecast the budget year +3 further years
  • The 2017-18 budget forecasts the budget year +2 further years

Look at the differences between the 2016-17 and 2017-18 longer-term forecasts in the graph above and you get a feel for how uncertain they are.  Despite this - per my last blog - the figure focused on in the commentary relates to that 2019-20 forecast relative to 2010-11 actual (despite the fact that this is a budgeting exercise for 2017-18).

You might argue that, however uncertain the forecast, it's reasonable to highlight the speculative longer term view relative to the historic peak. Even if you accept that, it's surely an observation that should be made in addition to not instead of explaining that the actual budget year under discussion is one with real-terms year-on-year spending growth.

Like me, maybe you've started wondering what that longer-term forecast is actually telling us - after all, by 2019-20 the Scottish Government is assumed to be responsible for 46% of that revenue (i.e. 46% of revenue raising powers will have been fully devolved). So you might think this forecast long-term real-terms decline is in large part a reflection of the Scottish Government's assessment of the effectiveness (or not) of their economic strategy and the impact of them using those powers.

But you'd be only partially right. Whilst there are explicit forecast assumptions about income tax, LBTT and Scottish Land-fill Tax, there is no assumption at all about Air Passenger Duty (APD). The commentary would certainly make you think that the planned APD reduction has been allowed for in the forecast: 
"we will introduce a Bill in the first year of the current Parliament to establish the tax which will replace APD in Scotland from 1 April 2018. We remain committed to delivering a 50 per cent reduction in the overall tax burden of APD by the end of this Parliament"
A 50% reduction in APD would amount to a 0.6% reduction in total Fiscal DEL in 2019-20 (before taking account of the economic activity benefits that might flow) - so it's not an insignificant consideration. But the forecast simply uses the OBR assumption for Scottish APD based on current policies because (I'm told) the forecasts can't make assumptions about legislation not yet passed.

The point is: the forecast is of limited value at best and - given this is a budget for 2017-18 - we should really focus on what it tells us about Scottish Spending in 2017-18.

What is tells us is that despite "Tory Austerity", Scottish Spending (whether you're looking at Fiscal DEL, Discretionary Spending Limits, Total DEL settlement from HMT or Total DEL) is rising in real terms.

Simple really.


Saturday, 17 December 2016

Spinning the Scottish Budget

I haven't had time for more than a cursory look at this and am indebted to the ever-diligent Fraser Whyte for pointing out this latest example of presentational spin by the Scottish Government [you really should follow him: @FraserWhyte81].

So taking this step-by-step;

The Scottish Draft Budget 2017-18 has just been published. Chapter 1 (which sets the financial context) includes just two tables of figures:


There are some glaringly obvious questions about how this data is presented:
  • Why is 2010-11 there but not the other years prior to 2015-16?
  • Why are there no year-on-year percentage changes shown, only cumulative?
  • Why are 2010-11 and 2015-16 chosen as the base years for the cumulative percentages?
The accompanying text referring to "UK Austerity" states:
"The UK Government’s approach to public spending is having a significant detrimental effect in Scotland. Between 2010-11 and 2019-20, the Scottish Government’s Fiscal Departmental Expenditure Limit (DEL) from HM Treasury will fall by over nine per cent in real terms"
We can see the -9.2% in the last column of Table 1.02 above. This is clearly the number they want us to focus on, because one of Nicola Sturgeon's special advisors took to Twitter last night (of which more later) to drive the point home
So let's unpack what's going on here.

First of all we have to understand the various different DEL (Departmental Expenditure Limits) figures quoted. I created the table below by just taking the key figures in table 1.01 above and showing how the various totals and sub-totals relate

The "Total Discretionary Spending Limits" row is what is used in table 1.02, where these figures are simply adjusted to real 2016-17 cash terms (i,e. adjusted for inflation). So when the budget text states "the Scottish Government’s Fiscal Departmental Expenditure Limit (DEL) from HM Treasury will fall by over nine per cent in real terms"  they are referring to Total Discretionary Spending Limits, where these are defined as:
  • Total DEL
    minus
  • Capital borrowing (i.e. devolved borrowing powers)
    minus
  • Net DEL adjustments (i.e. impact of devolved fiscal powers)
    minus
  • Financial transactions (i.e. effectively borrowing1)
    minus
  • Non-cash DEL (i.e. depreciation charges2)
    equals
  • Total Discretionary Spending Limits
So when the text refers to  "Fiscal DEL from HM Treasury" they are not referring to either "Total DEL" or "DEL Settlement from HM Treasury".

When Sturgeon's SpAd referred to Discretionary Spending Limits as "DEL totals" in that tweet above, it was in direct response to this tweet highlighting the fact that "Total DEL" was not shown in real terms and there were no year-on-year percentages shown (both undeniably true).
It was late, maybe Colin was just tired - but you'd think if you're Sturgeon's SpAd  you'd be careful not to wade in without understanding the figures or reading what was being said.

So now we know what we're looking at, how do we understand and interpret the trends? As Fraser Whyte quite reasonably pointed out on Twitter, it's kind of weird that there are only cumulative percentages and no year-on-year figures. Surely the Scottish Government isn't trying to avoid showing something that doesn't fit their preferred narrative?

Well let's see.

I went back to the 2015-16 Budget to be able to fill in the intervening years and put all figures in the same real 2016-17 terms as used in table 1.02. In doing so I recreated the percentages used in table 1.02, highlighted below in yellow.


If you're struggling to read that, here it is again just from 2014-15 which is really all we need to see

So what did the Scottish Government achieve by not showing 2014-15 as a relevant comparison year? Well firstly they avoided showing that Total Discretionary Spending Limit increased in real terms by 0.4% in 2015-16.

The table above also shows us that the Total DEL Settlement from HMT actually went up 1.7% in real terms in 2015-16 and our Total DEL went up by 2.7%.  I can't think why they would have chosen to present the data in such a way as to avoid this being clear.

Note also that in 2017-18 our total DEL will increase by 1.1% in real terms and cumulatively from 2014-15 to 2019-20 will increase by 1.4% in real terms.

Look at the figures in green showing the year-on-year and cumulative from 2014-15 trend in Total DEL - tells quite a different story from the "over 9% real terms reduction" doesn't it?

The yellow highlighted figures presented by the Scottish Government are true - but they offer at best a partial and at worst a cynically skewed picture of how the capacity for Scottish Departmental Spending is impacted by the HM Treasury settlement.

Is it too much to ask that our Government stops treating us as fools and just presents a fuller, clearer picture?

[I've dug a little deeper, it gets worse > Spinning the Scottish Budget: Part II]

****

Notes

1. Financial Transactions are allocated by HM Treasury to the Scottish Government and can only be used for the provision of loans or equity investment beyond the public sector. Financial Transactions facilities have to be repaid to HMT in future years.

2. depreciation or impairment costs associated with the ownership of assets. HM Treasury rules mean that this element of the overall DEL budget cannot be used to fund pay or procurement costs and as such this budget does not represent spending power for the Scottish Government.

Tuesday, 13 December 2016

Memetic Hogwash

This ridiculous meme first appeared several months ago and was throughly debunked at the time, but I see it's started cropping up on social media again


It is - like crime in a multi-story carpark - wrong on many levels.

"£2.8 billion whisky revenue counted as an English export (because it goes out through English ports)"
  1. No it isn't - not anywhere, not ever. This is simply a made up number, never sourced because there is no source. You don't need to read the other points below because the basic premise is simply made up. But if you're interested in other levels of wrongness ...

  2. There is no government "income" from whisky exports anyway - the economic value of this activity is captured in employment and corporate taxes which are of course correctly attributed to Scotland in the Scottish Government's own GERS figures

  3. Even if we're looking at export activity statistics (which have no direct impact on the £15bn fiscal deficit reported in GERS but would be relevant to an independent Scotland's current account deficit), these are of course unaffected by the port the goods happen to leave the British mainland from. Exports Statistics Scotland (ESS) figures are gathered based on customer locationa: if goods are exported from Scotland via an English port or freight-forwarder they will still be correctly recorded as Scottish exports.

  4. Peeling another layer of the onion and taking us further away from the specific lies in this meme, some suggest that because ESS figures are survey based they might be inaccurate. This is fair - no stats are perfect - but for what it's worth the way these survey forms are filled in makes it far more likely that they will understate "exports" to the rest of the UK than exports to the rest of the world. As a form-filler it's far easier to identify foreign currency export sales than sterling sales that happen to be South of the border

"£39.8 billion oil revenue said to be "unknown origin" added to Westminster balance sheet"
  1. No it isn't - The £39.8bn "unknown origin" figure comes from HMRC Regional Trade Statistics -and has nothing to do with government revenue (as reported in GERS or indeed anywhere else)

  2. There is no such thing as a "Westminster balance sheet" - this is concept apparently invented solely for the purposes of this meme

  3. If somebody was making a case for an independent Scotland's likely current account balance and missed out what would be counted as Scottish export trade by not including oil attributed in HMRC Trade Stats to "unknown region" ... then this would indeed be an issue, but I'm not aware that this has ever happened.

"I guess that will take care of the £15 billion black hole the Unionist Press goes on about"
  1. The £15 billion referred to here is presumably Scotland's notional deficit as reported in the Scottish Government's own GERS figuresb - that's where the press ("unionist" or otherwise) get the figure from

  2. Neither of the two other figures quoted in this meme have any bearing whatsoever on Scotland's £15 billion GERS deficit. Absolutely and unequivocally: no impact at all.

  3. Apart from anything else, how breathtakingly incompetent would you need to believe the SNP and Scottish Government to be for them to have missed these huge chunks of income when writing the independence White Paper?

"Just two examples of misappropriation of Scottish Income by Westminster"
  1. Neither of these figures have anything to do with income

  2. Neither of these figures are "appropriated by Westminster"

  3. er...that's it


*****


a. see official Scottish Government website here which explains "Export Statistics Scotland (ESS) is based on the Global Connections Survey". I have filled in these forms so I know, but see actual form here and note wording of question 6;


b. If we're being picky: as per 15-16 GERS figures it's £14.8bn so if the meme's using 2015 figures (as it claims) the figure would in fact be £14.3bn. The "black hole" is more correctly defined as how much worse Scotland's deficit is than that we bear by taking a population share of the UK's deficit, a figure in fact nearer £9 billion - but this is to critique this meme at a level of detail it clearly doesn't deserve. 

Wednesday, 7 December 2016

Changing The Rules of The Game

The 1.6 million Scots who voted for independence in September 2014, the 17.4 million Brits who voted for Brexit in June this year and the 62.5 million Americans who voted for Trump last month all share something in common: they want to see the rules of the game dramatically changed.

If, like me, you’re unsettled by this, maybe ask yourself how well the current rules of the game have suited you and – perhaps more importantly - what are you doing to make the rules fairer?

If you’re broadly successful and content with life, chances are the rules have suited you pretty well. That doesn’t necessarily mean you’ve had it easy, that you haven’t had to work hard to get to where you are.  But it probably does mean that you have an aversion to the idea of tearing up the rule book. After all, who wants the rules to change just when they’ve sussed out how to play the game?

It's traditionally been easy to remain complacent about the need for change, because those with voices most likely to be heard tend to be those for whom the current system works. Newspaper editors, media personalities, enigmatic politicians, successful business people – most of them are where they are because they've learned how to play the game well. The reason they’re in a position to be heard - and perhaps drive change - is also the reason why many have a vested interest in maintaining the status quo.

But the truth is we have both a moral obligation and a pragmatic incentive to keep changing the rules of the game so they’re fairer for all. The moral imperative has always been there, but maybe these recent votes will serve to shake the more complacent into pragmatic action. Change is coming, the only question really is who will be the architects of that change?

Take today's speech by Scottish Labout leader Kezia Dugdale calling for a new federal "Act of Union". It will be sniffed at by those on one side who fear change and those on the other who reject any proposal that falls short of full independence. But to resist any change is to ignore the 1.6 million people who voted Yes; to insist independence is the only acceptable option is to ignore the 2.0 million who voted No. The rules of the game need to change - personally I think it's encouraging to see Scottish Labour seeking a constructive solution.

Similarly, those who fight tooth and nail against progressive taxation measures and modest steps to improve wealth distribution would do well to compare the “injustice” of paying a bit more tax with the injustices of, to name but a few: tax avoidance, excessive executive pay, exploitative employment contracts, low wages, the educational attainment gap, food poverty, child poverty and urban deprivation.

Look at the evidence of our recent plebiscites: our failure to keep changing the rules of the game for the better has created a large body of people who feel any change must be better than what they’ve currently got.

This has created an opportunity for Machiavellian chancers to grasp for power by appealing to the disenfranchised and malcontented. The likes of the SNP, Farage and Trump offer voters a chance to dramatically change the rules of the game and take a free swing at the liberal elite into the bargain.

To be fair to them, these narrow-minded, populist policy peddling fundamentalists do genuinely want to change the rules of the game. It's just that their objective is to gain more power for themselves with little or no concern for the price paid by others.

If we are currently ruled by a "liberal elite", let's hope that they realise before it's too late that their failure to keep changing the rules of the game for the better opens the door for the "illiberal elite" to replace them.